oxitopview
The oxitopview utility encapsulates the functionality of the command line utilities (with the exception of oxitopemu) with a graphical interface. If matplotlib is installed it also provides a rudimentary graphing facility for data obtained from the unit.
Downloading Data
After starting the application from your platform’s launcher, click on the Connect icon (the first icon on the toolbar) or select . A dialog will appear prompting you for the serial port that the OxiTop OC110 unit is attached to.
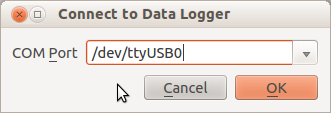
If your platform supports enumeration of serial ports you may be able to use
the drop-down list to select from the available ports on your computer.
Otherwise, you will need to manually enter the name of the serial port to which
the device is attached. On Windows this will typically be something like
COM1 (or some higher number if you are using a USB-attached serial port),
while on UNIX-based platforms (like Mac OS X and Linux) it will typically be
something like /dev/ttyUSB0 (for a USB-attached serial port).
Ensure the unit is connected and turned on, then click OK. The application will attempt to open the serial port, and download the list of bottles stored on the device.
Note
Currently, it is frequently necessary to “nudge” the OC110 to get it to enter serial mode. Immediately after clicking OK, press the Up/Down buttons on the OC110 to wake it up and get it to enter serial mode; when in serial mode, the unit displays “V.24 Modus” on the screen. If you do not see this, then you will need to retry.
The status bar at the bottom of the application indicates serial port activity (currently rather crudely) with a Communicating label. Once the bottle list has downloaded it is displayed in a table:
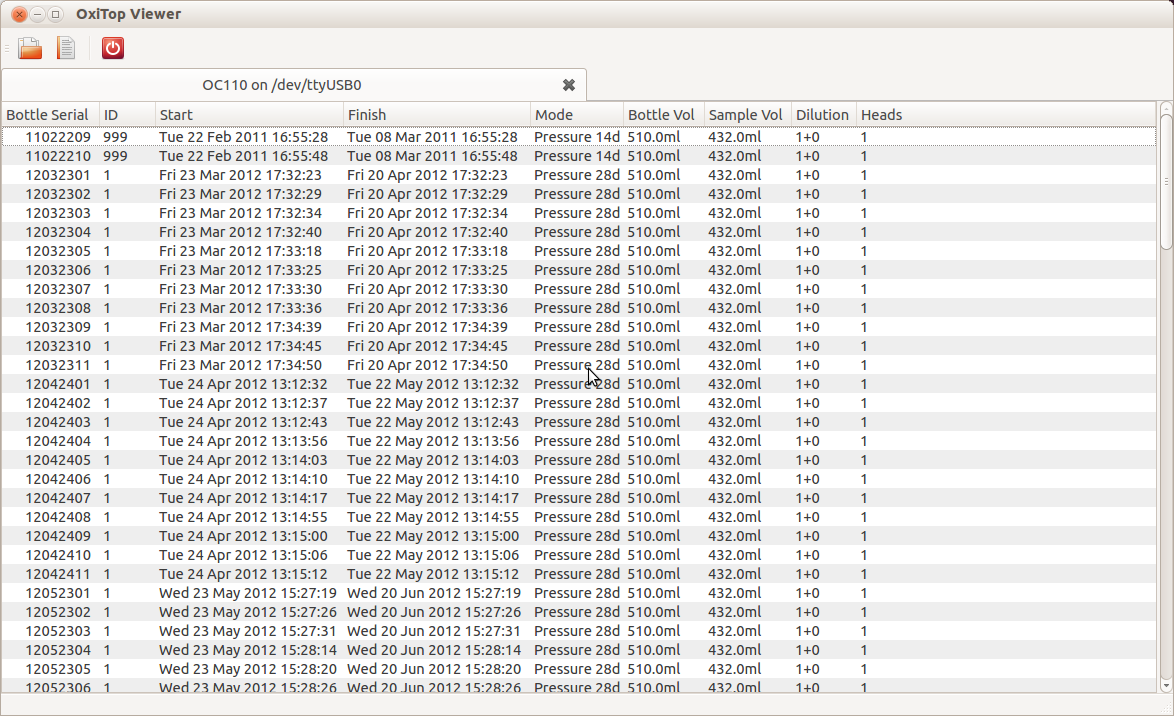
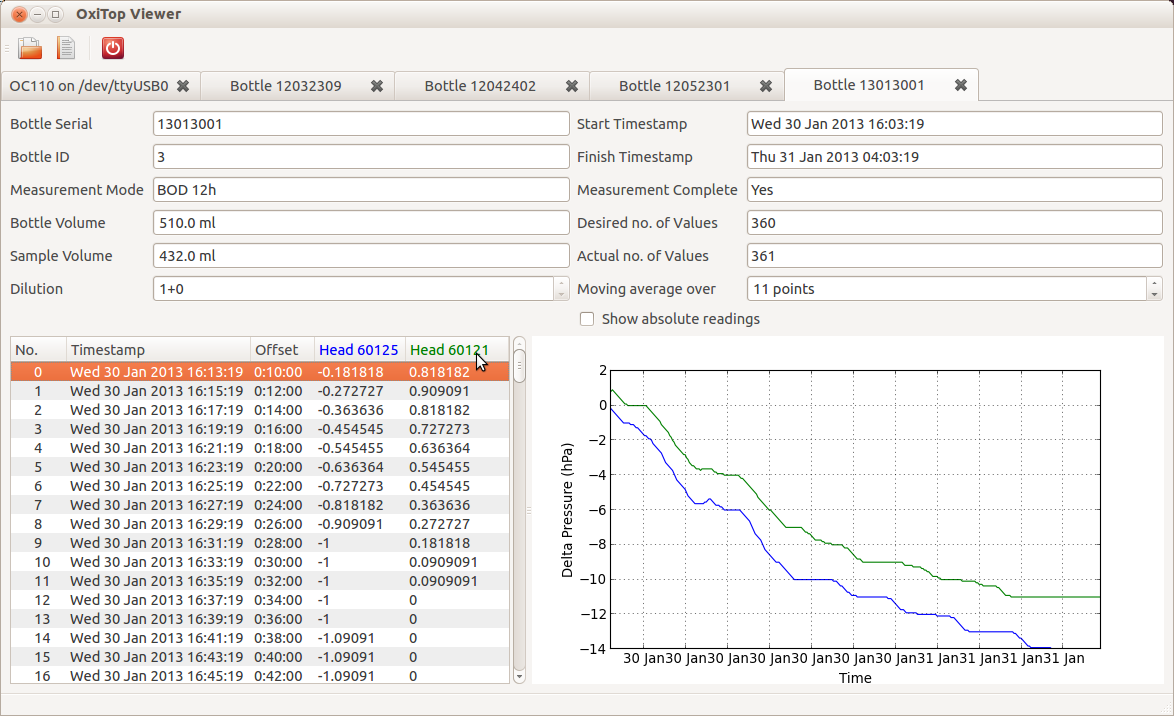
Each line represents a single set of readings (which for BOD mode runs may incorporate multiple heads). Double-click on a row to query the device for the readings from that run. Once again, the unit will be queried over the serial port, and the Communicating label will flash on the status bar. Once the readings have been downloaded, the details will be shown in a new tab within the application:
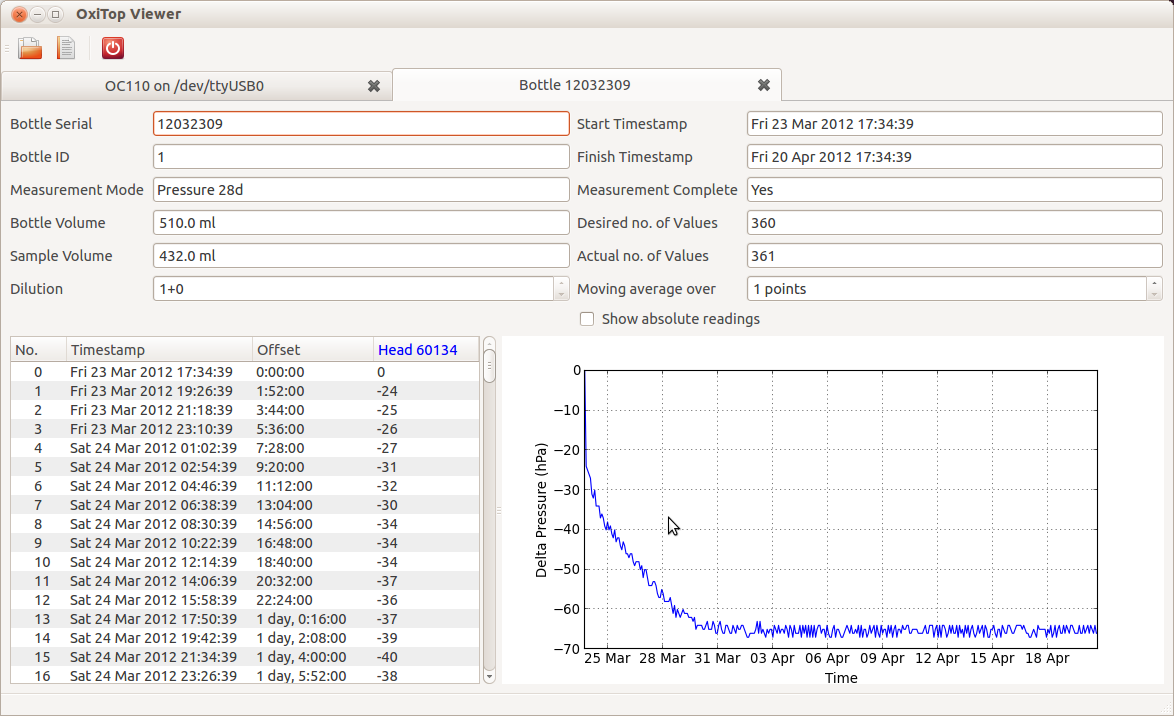
Most of the controls in the tab are read-only, with the exception of two:
- The Moving average spinner allows you to calculate a center-based moving average over the specified number of readings.
- The Show absolute readings check-box allows you to toggle between delta pressure readings (the default) and absolute pressure readings.
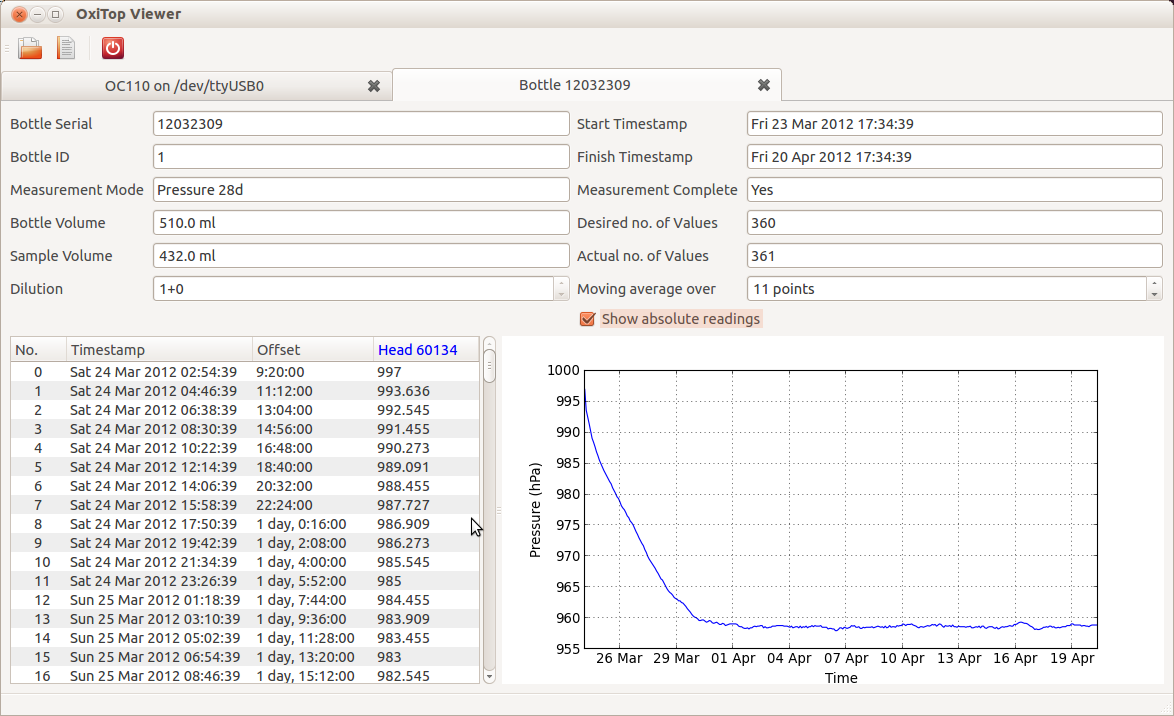
Note that multiple sets of readings can be opened simultaneously. Each will appear in its own tab. For readings involving multiple heads (BOD mode only), the columns of the readings table will be colored the same as the corresponding line in the graph:
Note
Also be aware that, once a set of readings has been downloaded, the application caches it (for as long as it is running) so that re-opening the tab will be near instantaneous. To force the application to re-download the readings from the unit, use the menu option.
Exporting Data
You can export the available set of readings from the main window, or an individual set of readings from a readings tab. To do so, simply select the menu entry. A file-save dialog will appear, prompting you to enter a filename in which to save the data. The name of the file will determine the format the data is exported in (or, on some platforms you can select the format from the file-type drop-down at the bottom of the dialog). Currently two export formats are supported:
- CSV - Comma Separated Values. A simple text-based format which doesn’t allow any formatting or multiple data-sets, but is easily accessible and universally supported. When data readings are exported in this format, only the readings will be included - not data about the bottle head (start and stop times, etc.)
- Excel - specifically the old-style .xls binary Excel format. This format permits multiple sheets and more formatting options, but is not open and not universally supported (although it is widely supported). When data readings are exported in this format, data about the bottle head (start and stop times, etc.) will be included in a separate sheet.
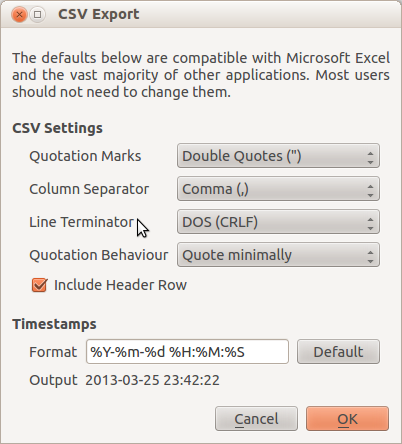
After selecting an export filename and clicking on OK, you will be presented with a format-dependent dialog to select additional export options. For CSV, this includes the record and field delimiters to use (it is generally best to stick to the defaults of DOS-style line breaks and comma field separators), and how to format timestamps (the default is the unambiguous ISO8601 YYYY-MM-DD style):
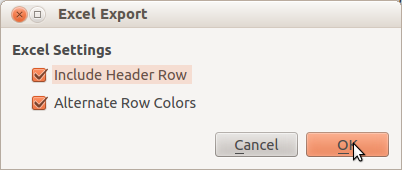
For Excel exports, the dialog simply determines whether to include a header row and whether to alternately color data-rows:
Note
When exporting bottle readings, the Show absolute readings and Moving average controls will affect the exported data. If you want to export the raw readings from the device, remember to reset these controls prior to exporting.
Exporting Graphs
Currently, there is no facility for exporting the graphs drawn by the application. If you wish to plot the data for publication, you are encouraged to use the CSV export facility described above and import the data into a good scientific graphing application like the excellent Veusz (Excel’s graphing facilities are rudimentary at best and, lacking decent vector facilities, are no good for publishing).